|
|
Metric
The metric defines the location, the direction and the distance of objects in space.
E.g. it is used to calculate the distance between objects, to detect the shortest path or
to identify the nearest neighbor.
The Euclidean Distance is an example of a mathematical
metric space. It gives the distance between two points as the length of a straight line segment
between them. A metric space can be a simple distance function. Remember the Pythagorean
Theorem from school?
 Example Euclidean Distance
The following three conditions must be satisfied to make a space a metric space:
Metric Room
A set of points S is called metric space, if a distance function distance() exists, which returns for each pair (s, t) of elements in S the distance (s, t) between them. The distance value is returned as real number and satisfies the following conditions:- For each pair s,
t in S,
distance(s,
t) > 0, if
s and
t are disjoint points and
distance(s, t) = 0, if s and t are identical. - For each pair s, t in S, distance(s, t)= distance(t, s
- For all triples s, t, u in S distance(s, t) + distance(t, u) >= distance(s, u), also known as triangle inequality (for points which are not lying on a straight line).
There are various types of metric spaces. They are mainly used in digital image processing, such as in remote sensing. In GIS, the metric space used generally is the Euclidean metric. To demonstrate the influence of the metric on the distance calculation, the Manhattan metric, also called Cityblock metric or Taxidriver metric, is introduced. In most of the cases, beelines are not suitable to detect distances that are physically feasible. As an example have a look at the map of Manhattan. The region of Manhattan is neither flat nor empty, but structured by its road system. The Manhattan metric follows the same logic as the taxi driver in Manhattan: He would drive two blocks north and subsequently three blocks east. Thus, only trips along the four cardinal directions are possible. The Manhattan metric is defined as follows:
 Example Manhattan Metric
The Manhattan metric meets all three conditions. But it is variable regarding the orientation of
the coordinate system. The distance changes in the case that the axes of the coordinate system are reoriented.
It is reasonable to apply the Manhattan distance only in cities with a grid like structure and a coordinate
system that follows the road axes.
The form of the glob is a real constraint for the use of metric for the distance calculation. The goal of the
map production is to represent the spherical shape on a plane surface. For small scale maps, the geographical
coordinate system can be imaged in the plane. The resulting coordinate grid is curvilinear. For many applications,
and to simplify the calculation, it is reasonable to take a Cartesian (rectangular) coordinate system. This
system is mostly used for large scale maps: e.g. 1:25’000 and 1:50’000, such as the maps of Switzerland. In
the case, that a limited space is mapped, the curvature of the earth can be neglected. For maps with small
scales, less than 1:50’000, the curvature has to be taken into account, the distances are calculated using
spherical distances.
Catchment areas of shopping centers
There are four shopping centers indicated on the map. The catchment area is not known. For the analysis, the following points are assumed: Clients prefer the shopping center which is the closest to their place of residence. For this purpose, the distance between two shopping centers is divided in half, according to the metric space chosen. The resulting limits build the shopping centers’ catchment areas, including all the corresponding domiciles. The resulting polygons are called Thiessen polygons. For further information have a look at unit "Analyse von Distanzbeziehungen". The following animation illustrates the influence of the metric space on the calculation of distance.
Time as distance function
Another description of distance is the time. This concept is illustrated by means of two maps:
 Isochrones maps (maps showing lines of equivalent travel distance)
 Time maps (transformation of the geographic space to the time space)
Isochrones maps:
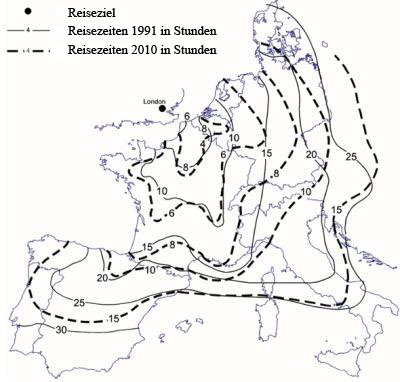
The figure shows the isochrones maps of travel time by train from London for the years 1991 to 2010 (Spiekermann 1999). Isochrones maps provide spatially the temporal distance from a given location (e.g. London) to all the other locations on the map. A big distance between the isochrones indicates a lot of space that is overcome per time unit. That means e.g. that the public transport network is well developed, such as in France between Lyon and Paris. The disadvantage of such isochrones maps is that the temporal distance can be represented just for one starting point. Furthermore, the illustration of the development over several years is confusing.
 Example of an isochrome map (Spiekermann 1999)
Time maps:
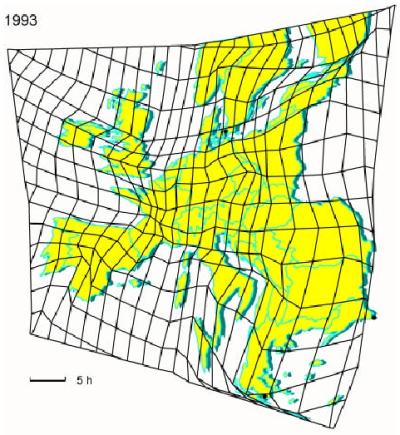
The following figure shows a time map for the railway traffic in 1993 (Spiekermann 1999). Time maps are transformed from the Euclidean space to the "time space", using a mathematical method. The faster the transportation is, the more shrunken is the space. The distances on the maps are no longer proportional to physical distances, but proportional to the traveling time between them. The measuring unit is given by the time. The TGV railway, existing since 1993, makes France shrinking. In contrast to France, the railways infrastructures in southeast Europe is relatively sparse, which makes this region expand.
 Zeitkarte am Beispiel von Reisezeiten (Spiekermann 1999)