|
|
Fuzzy overlay
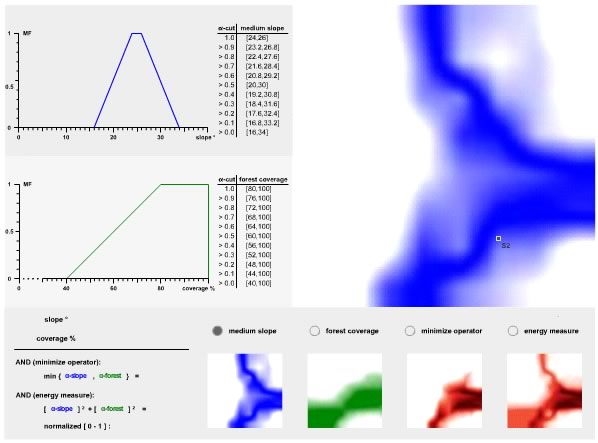
Since our initial scope in this use case was to identify potential habitat regions for the reintroduction of the wolf, we must now ask how to overlay different fuzzified variables. How can we identify suitable regions that have a "medium slope" and are "densely forested"? Now the problem gets tricky and the GIScience literature gives different approaches to this question. The subsequent work with the animation below will clarify some ideas for fuzzy overlay.
Please be very clear about the basic differences to the combinations described above. Whereas we compared above small apples with big apples, we now compare their size with their colour. Above we combined classes of the same variable of a site, we now have to combine different variables in order to perform our suitability analysis.
Brute force: minimise
The simple brute force approach again uses the "minimise operator" for this intersection task (AND):
d.o.m (A AND B) = min {d.o.m. A, d.o.m. B} (3)
With A representing the fuzzy set "medium slope" and B representing the fuzzy set "densely forested". Click for instance on site S2 in the animation. The arising problem is that one of the participating d.o.m. values dominates by assigning its value to the whole decision criterion.
In the literature, there are several other approaches for the logical combination of fuzzy sets of different variables. These approaches are in most cases complex and their results are difficult to interpret. However they provide better results than brute force minimising. In this unit, we focus only on the illustration of one idea, the use of an "energy measure".
Energy measure: add the squares
This measure combines the d.o.m. for both sub-layers by adding their squares (Gupta et al. 1988).
d.o.m (A AND B) = [d.o.m. A]2 + [d.o.m. B]2 (4)
With A representing the fuzzy set "medium slope" and B representing the fuzzy set "densely forested". Note that the energy measure should be normalized in the fuzzy domain [0,1]. This measure accounts for both variables. Using the squares favours the variable with the greater possibility of fitting the criteria posed by the decision makers. Check again S2, now using the energy measure.

