|
|
When use fuzzy ideas?
Every GIS-based suitability analysis uses a conceptual data model, a human conceptualization of reality. This abstraction of the real world incorporates only those properties thought to be relevant to the analysis. Whenever this conceptual data model features ambiguity, vagueness and uncertainty, you may want to use fuzzy concepts. There are several ambiguous and uncertain aspects when modelling the wolf habitat. For example, the crisp sketching of a tree line somewhere in the gradual transition from meadow to forest is highly uncertain. Or the regular and apparently smooth DEM surface is probably interpolated from relatively sparse sample points. Thus, modelling slope with three crisp sets hardly represents reality. For this reason we use fuzzy concepts of the different slope classes.
Attribute fuzzification vs. space fuzzification
The above use of FMF performs a fuzzification of the attributes of uncertain geographic information. The fuzziness reflects the uncertainty of an entity belonging or not belonging to an attribute class (here called set). In contrast, one could also fuzzify the spatial aspect of geographic information by dissolving e.g. the crisp boundaries of a map of categorical data. In this case, the fuzziness reflects the uncertainty of the exact location of, the borderline of a polygon, assigning central sites in the polygon a high d.o.m. and marginal sites a low d.o.m. Here the fuzzified polygon boundary gets the character of a transition zone from 0 (not member) to 1 (member).
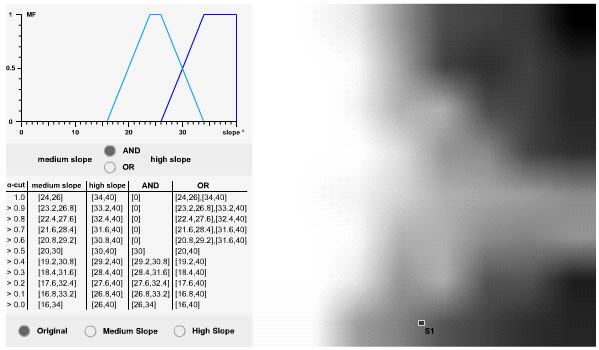
Just as with Boolean sets, fuzzy sets can be combined using logical operators. In this unit we focus on fuzzy union and intersect, corresponding to Boolean OR and AND. In contrast to Boolean logic, the fuzzy membership functions permit entities to be partial members of different, overlapping sets. Thus, for site S1 with a measured slope of 26.84° we could at the same time indicate two different d.o.m. to the set "medium slope" (d.o.m. = 0.895) and "high slope" (d.o.m. = 0.105). This seems to be rather strange at first glance, so let’s take a closer look at that with the above animation!
The MF panel shows the FMF of the two adjacent classes "medium slope" and "high slope". Switching in the control panel (bottom left) from the "Original" to "medium slope" or "high slope" respectively, you may visualize the two fuzzy subsets of the variable "slope" in the map panel. Selecting any site by clicking in the map panel highlights its position in the FMF with a vertical bar and plots its attributes (slope, d.o.m. medium slope, d.o.m. high slope). But what happens if you select a site in the transition zone between medium and high slope, where the FMF overlaps?
Let’s look again at site S1 with a slope of 26.84°. Click it in the animation! From the FMF we get 0.895 for medium slope and 0.105 for high slope. The combinations of union and intersect use a rather intuitive approach.
Union: maximise
If we want to know to which possibility a site is a member of either medium or high slope, we take the maximum of the two values:
d.o.m (A OR B) = max {d.o.m. A, d.o.m. B} (1)
With A representing the fuzzy set "medium slope" and B representing the fuzzy set "high slope". The use of maximise for union becomes obvious looking at the vertical bar. At position 26.84 the two single FMF overlap. If site S1 must only be a member of one of the two sets to fulfil the logical query, it is best represented choosing the higher possibility of membership. Which is in this case the 0.895 of medium slope. Note that the corresponding a-cut is selected in table panel.
Intersect: minimise
In contrast, if we are interested in the possibility site S1 is a member of medium and high slope, we take the minimum of the two values:
d.o.m (A AND B) = min {d.o.m. A, d.o.m. B} (2)
In this case, site S1 must be at the same time a member of both fuzzy sets which is only fulfilled for the minimum value taken at the position of the vertical bar.
Clicking around in the above animation you can now see that an individual entity in the transition zone can be a partial member of two sets of the same variable (slope).

