|
|
Idea of Fuzzyness
Fuzzy logic is based on the concept of partial truth. Whereas, classical logic holds that everything can be expressed in binary
terms, fuzzy logic replaces Boolean truth values with degrees of truth, very similar in nature to probabilities (except that
they need not sum to one). Fuzziness is a type of imprecision characterising classes that for various reasons cannot have or do not have sharply defined
boundaries. These inexactly defined classes are called
(Burrough et al. 1998). Thus, handling "slope" in our use case would require discriminating three fuzzy sets: "easy-angled, "medium" and "steep".
For every site in space we could then calculate a certainty of a location being a member of "easy-angled, "medium" and "steep".
The certainty of an entity belonging to a fuzzy set is derived from a ![]() fuzzy sets
fuzzy sets![]() fuzzy membership function (FMF). The degree of membership (d.o.m.) takes values from 1 to 0, with 1 representing complete certainty of membership and 0 representing
non-membership. Let us use the fuzzy set "medium" to illustrate the idea of MF.
fuzzy membership function (FMF). The degree of membership (d.o.m.) takes values from 1 to 0, with 1 representing complete certainty of membership and 0 representing
non-membership. Let us use the fuzzy set "medium" to illustrate the idea of MF.
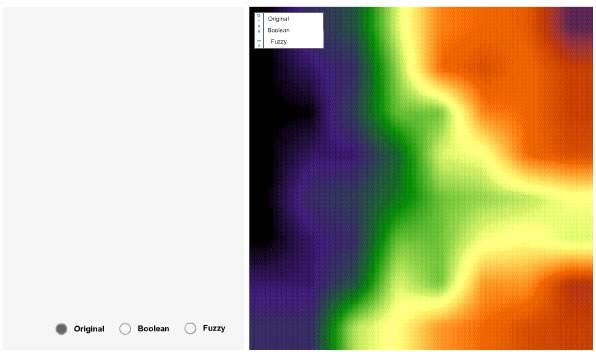
The map panel (right) shows first the digital elevation model (DEM) of the use case space in a raster format. Clicking on the button "Boolean" in the control panel (bottom left) you can visualize first the Boolean set for medium slope. The map panel now shows a map with a clear-cut black region containing the sites (pixels) belonging to the set "medium slope". In this Boolean case, the boundaries of the classes are sharp, so called crisp, allowing no doubt about the membership of an entity. The d.o.m. of a site may only be 1 for belonging to "medium slope" or 0 for not belonging to "medium slope". This is represented in the MF panel (top left).
- Sites with an elevation between 20° and 30° take a d.o.m. of 1, thus are with complete certainty members of the class "medium slope".
- Sites with an elevation below 20° and above 30° take a d.o.m. of 0, thus are not members of the class "medium slope".
All possible d.o.m. plotted against all elevation values build the membership function. In the Boolean case, the MF has a rectangular shape with vertical transitions from 0 to 1. Clicking around in the map panel highlights the elevation values and their associated d.o.m.
The most obvious change using the fuzzy set (click "Fuzzy" button) is the dissolving of the crisp region in the map panel. This fuzzification is best plotted in the transition of the rectangular MF into a trapezoidal shaped function in the MF panel. Read the FMF as follows:
- Only sites with an elevation between 24° and 26° are assigned to medium slope with a d.o.m. of 1.
- The d.o.m. increases linearly from 0 to 1 between 16° and 24°, and decreases linearly from 1 to 0 between 26° and 34° respectively.
- Sites with elevation values below 16° and above 34° get a d.o.m. of 0.
Again, you may click any pixel in the map panel to derive its d.o.m. to "medium slope" from the position of the vertical bar in the MF panel. The FMF can have different shapes. Triangular, trapezoidal and bell-shaped functions are often seen. In this unit, we will not discuss when to choose which shape. You can find a discussion on this in (1998).
The d.o.m. is often classified in discrete intervals called alpha-cuts. An alpha-cut is the subset of all entities whose d.o.m. is greater than some threshold alpha, whereas 0<alpha<1. For example the 0.8 alpha-cut denotes all entities whose d.o.m. lies above 0.8. From the table you can see that all these entities lie in the interval between 22.4 and 27.6. If you click on a raster cell in the map panel, the corresponding alpha-cut is highlighted in the table.
Can you define the slope values of cells with d.o.m. greater than 0.6 for the Boolean and the fuzzy MF given in the animation above? (Click here for more information)

