Indices of structure at the level of the categories / classes of objects
Among
the indices of Table 3.1, those of surface
and density are already known. Here the description of the other indices.
|
| Index of density of contours (ED): |
|
|
Σpij : sum of perimeters (m) of all the
objects j pertaining to category i
A: surface (m2) of the study area
|
|
|
| Average index of shape (MSI): |
|
|
| ni: number of objects of category / class i
|
|
|
| Average fractal index (MPFD): |
|
|
Interpretation: Index value MPFD varies between 1 and 2.
The more complex the average shape of the objects of the class is,
the more its value approaches 2.
|
|
|
| A Index of average distance to neighbors of same category/class (MNN): |
|
|
hij: shortest distance (m) between
the limit of
the object i and that of the nearest
object j of the same category.
|
|
|
| Index of dispersion distance to the neighbors
of same category/class (NNSD): |
|
|
|
|
| Coefficient of variation of the distance to the
neighbors of same category/class (NNCV): |
|
|
|
|
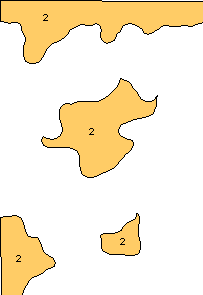
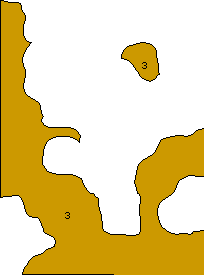
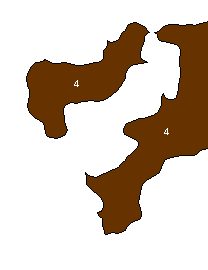
4 classes of spatial objects in the study area
|
|
|
| Class of objects of poor aptitude (1) |
Class of objects of poor aptitude (2) |
|
|
|
| Class of objects of poor aptitude (3) |
Class of objects of poor aptitude (4) |
Figure 3.3 |
|
|
Value of the indices
of structure for the 4 classes of objects
in the study area illustrated in Figure 3.3 |
|
|
|
Exercises on Figure 3.3 and Table 3.3
- On Figure 3.3 identify the classes:
- whose surface is respectively smallest, largest
- whose perimeter is respectively smallest, largest
- whose shape is respectively simplest, most complex
- whose average distance between the entities is largest
- Compare your visual interpretation with the value of the
indices in Table 3.3:
- which are the geometrical properties simplest
and most difficult to estimate?
- which is the relation between the value of the average index
of shape and that of the average fractal index?


