Step 3: Set-up the Map Parameters
The essence of cartography has to be considered here: the message which has to be understood by the map user is put in a graphical form. A full consideration of all cartographic criteria for this step is not possible; so we will only analyze the main and essential elements. So, in this step you have to think about the graphical aspect of the map: which elements do you want to present, in which graphical form? By taking into account time and data possibilities, the following criteria must be determined:
- Reverse: If the map media is paper, you must check if the reverse can also be used for printing. Sometimes more information
can be put here: tourism information, sponsors, address, diagrams, smaller map, etc. Below is an example the map of the region
"Jungfrau" (Switzerland): the front of the map represents the area in winter season, and the back represents the same area
in summer. Rollover the map to show the back side.
Front/back of a touristic information map (Grindelwald Tourismus) - Folding: A map can be folded for two reasons:
- For ergonomic reasons: because a hiker or a car driver cannot use an A0 map continuously, the map has to be folded. In this case, you have to take into consideration the front and back cover: between which map folding will take place. Try also to do in sort, so the map reader reaches the most important information first when he/she unfolds the map.
- For cutting reasons: If you have to create some pages for a book, or a brochure, you have to take care with the folding, which will be cut afterwards.
- Basemap: Generally, the basemap is made up of territory outlines and borders; but hydrography, orography, landuse, etc. and
other elements can also be shown. In this case, the basemap should still be set graphically back from mapped information.
Inside the global layout of the map, the basemap can be represented in two ways:- As a map on which only a selected area is mapped in full; or as a map on which details do not extend over the whole of the
area enclosed by the neat line.
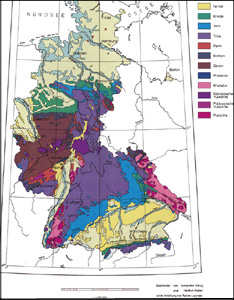
 Map of German geology, student work
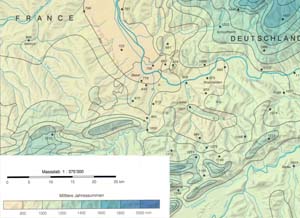
 - As a map on which only the details extend over the whole area enclosed by the neat line or by a bleeding edge
 Map of the rainfall in the region of Basel, student work IKA
- As a map on which only a selected area is mapped in full; or as a map on which details do not extend over the whole of the
area enclosed by the neat line.
- Projection system: Determine a projection system. Further information can be found in the module Basic Data Capture.
- Represented elements of the basemap: Determine which elements should be present: relief, shading, etc. depends of the user group, the aim, etc. Further information can be found in the lesson, Thematic Data Presentation of the Intermediate Presentation Module.
- Format, working and publication scale: Determine a working and publication scale. Further information can be found in the unit Map Size and Scale
- Generalisation: Define the degree of generalisation. Further information can be found in the Lesson Generalisation of map data.
- Map elements: Define the map elements: map symbols, font, colour-range, etc. Further information can be found at the lesson Thematic Data Presentation of the Intermediate Presentation Module.
- Design: Determine a global graphic design outline. Further information can be found in the Lesson Layout Design.
REMARK:
The order of these criteria can be significant, so take this into consideration when determining your map parameters. In addition,
like the other steps, you should still avoid the reader drawing an incorrect conclusion. For example, a hastily made map was
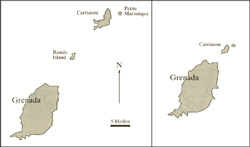
used in the invasion of Grenada by USA (1983): a psychiatric hospital was bombed because of wrong information on these maps.
The following right map shows an incorrect presentation of Grenada Island used in the lesson. Left shows the correct map presentation. Incorrect presentation of Grenada Island (Monmonier 1996)
You have to produce a new map of the hiking paths in Switzerland. The
appropriate data for the map are already collected, and the map format will be A0.
Choose in which chronological order you will set-up the map parameters by draging and
dropping them next to the chronological numbers.
