


Next: Neighbourhood operations and filtering
Up: GEOG205: Lecture 4: From
Previous: GEOG205: Lecture 4: From
The last lecture presented an outline of computational processes and how they are incorporated into the scripting languages of GIS. This lecture is concerned with extending our as yet limited toolbox of compound procedures from just manipulating attributes in-place, and overlaying map layers, to make use of our knowledge of where geographical objects are located. We will in turn see how distance and the measurement of distance can be introduced, next how objects close to one another may be related, and finally how to start dealing with surfaces. On Thursday, we will complete our treatment of analysis by bringing in iterative methods for viewsheds, cost accumulation, drainage, and network operations, together with interpolation methods.
Since map layers contain geometric information on where the objects and their attributes are placed, we can use this to answer more complex questions than ``what'', ``where'', and combinations of ``what'' questions, such as ``where are cells classified as inhabited in the population layer that are classified as water in the land cover layer''. We introduce questions like ``how far'', ``how near'', and the ``buffer'' concept.
- The spatial reference system and distance measurement
- In order to measure distance or direction, even on a single map layer, we have to know its spatial reference system.
- We also have to be aware that assumptions made in projection geometry and choice of geoid will introduce errors into our measurements. Further, if the data we are using are secondary, for instance scanned or digitised from paper maps, the printed representation will also deviate from the original drawings, and may also have been subject to geometric generalisation in draughting.
- However, since all measurements are approximations, we handle this by giving upper and lower bounds for our results.
- Finally, in phenomena we are interested in, measurement results will be scale-dependent, because of the fractal nature of many natural phenomena in vegetation and geomorphology, which feed through into landscape studies.
- Measuring distance in the raster and vector approaches
- Raster map layers are defined in terms of a regular grid. Given that the grid cells have been assigned dimensions measured say in metres, distances in the grid can be established by counting the number of intervening cells if the distance to be measured follows grid lines.
- If the required distance cuts across the grid pattern, the measurement line will either be built up of straight lines and diagonals close to the ``true'' line, or be taken between the centroids of the two cells.
- Vector systems are designed to measure distances directly in the chosen coordinate system, and are limited by the tolerances of the input hardware rather than any quality of the map layer. Finding attribute values along the transect described by the line drawn is more challenging.
- Raster systems can do this at little extra cost. Most raster systems ``play'' at using vector precision for distance measurement, but for analysis they use ``queen'' movements for each step.
- Remember that distances are measured in the plane.
Figure 1:
Measuring the distance between M1 junctions 22 and 23.
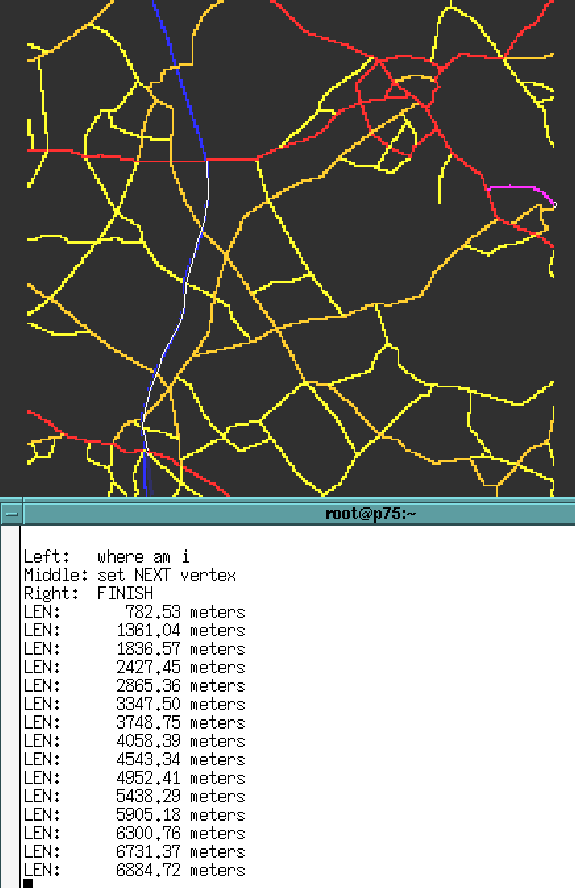 |
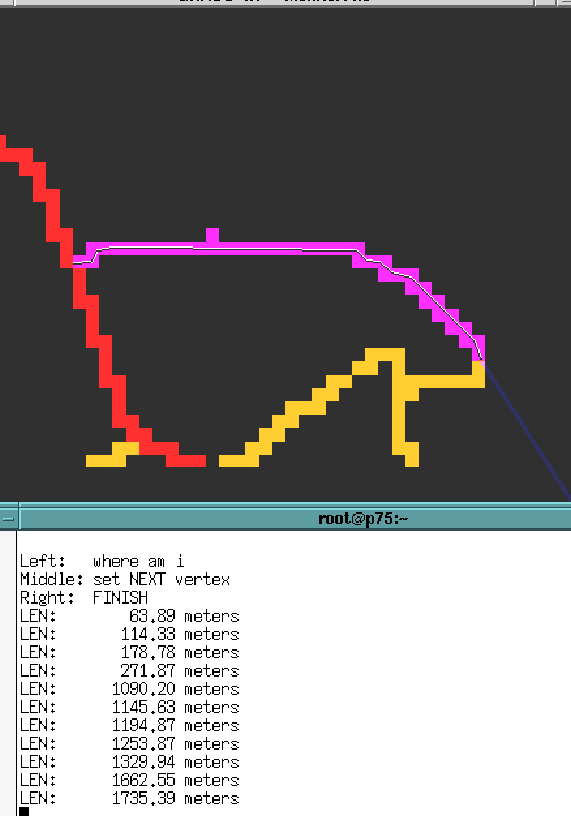
Figure 2:
Zooming to measure with more (spurious?) precision.
 |
- Buffers and their application
- Now that we can measure distances between objects, it follows that we can also measure distances around them too. This is known as the buffer operation, and will either yield categories within chosen distances, or a ``spread'' of increasing distances from the chosen objects to be reclassified or ``sliced'' later.
- A typical use of buffers is to determine zones around point or linear objects to which a specific management regime is to be applied. If the buffer is one-sided, it can be termed a ``set-back''.
- Buffers can also be constructed around area objects; this essentially involves three steps. The procedure first finds the edge of the object, then buffers out from that as if it were a line, and finally removes the buffer areas in the object's interior.
- Buffer map layers can be used like all other layers, for example by overlay to establish whether land use categories approach each other too closely. Remember that the distances measured may not be exact, and try to set the buffer distances in the light of the precision of your input map layer.
Figure 3:
Buffers around a layer showing watercourses.
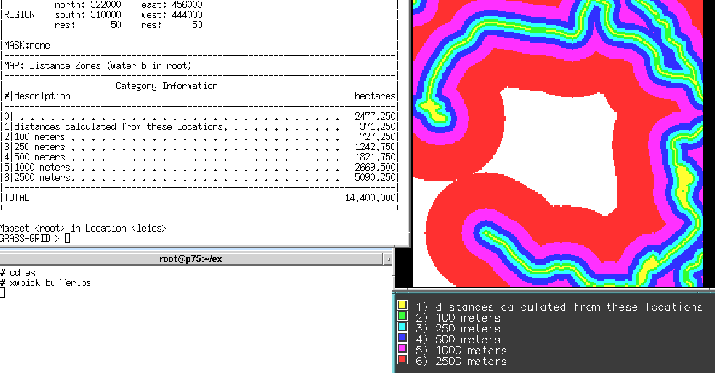 |
Figure 4:
Buffers around land use category quarries.
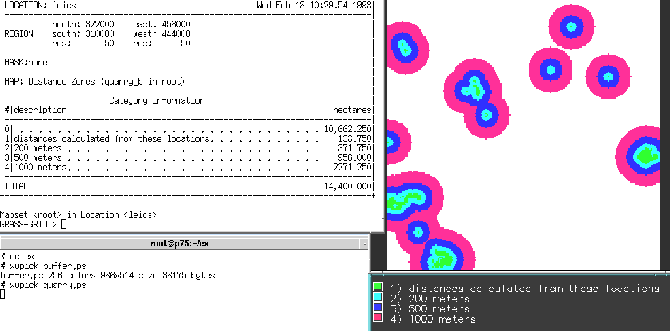 |
Figure 5:
Quarry buffers and residential land use overlay.
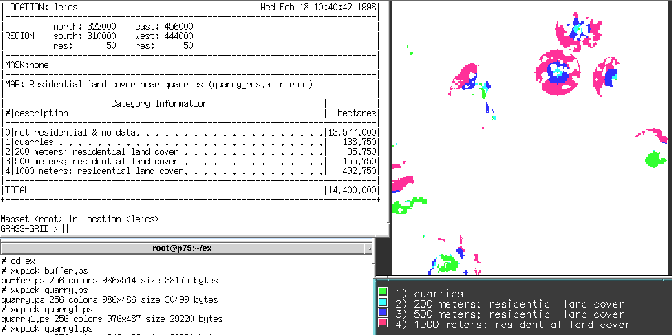 |
- Triangulation and Voronoi diagrams
- If we have several point objects, and spread distance measurements out from each, we will find that half-way between each pair (by definition) the distances will be equal. This operation of ``fencing'' is the raster equivalent of the geometric procedure of triangulation.
- Triangulation starts from a distribution of point objects in the plane, and constructs lines between them. Obviously some lines cross each other, and in these cases the shorter line is retained. This ``Delaunay'' triangulation defines for each point its set of proximal neighbours. The ``Voronoi'' or ``Dirichlet'' tesselation is then found by drawing new lines at 90 degrees to the midpoints of this triangulation, to form polygons. These polygons define the area which is ``closest'' to the point in the chosen metric.
- Triangulation can also be used as a procedure for contouring when the points have an attribute value, but it starts off just as a way of partitioning space and finding the set of proximal neighbours for each point.
- For regularly spaced points in a square grid, the ``Voronoi'' tesselation is the pattern of grid cells. Each has four proximal neighbours in the ``rook'' (trn) pattern.
Next: Neighbourhood operations and filtering
Up: GEOG205: Lecture 4: From
Previous: GEOG205: Lecture 4: From
Roger Bivand
2001-12-20