|
|
GIS tasks: visualising information
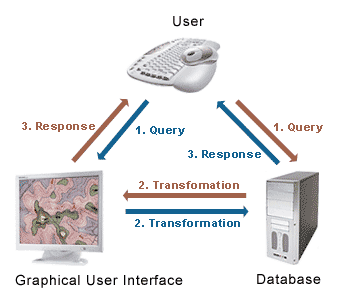
 Illustration after (Bill 1999) |
People visualize by nature. An image based on a visualisation of geodata such as a map or an animation is far easier to understand than the same information provided in text or a table. Visualisation is used to reduce complexity and it enables you to focus on the selected key features, the purpose of the information. It helps you to understand complex processes; to make decisions or explain what otherwise could be cluttered by details. Maps have traditionally been used to represent real-world objects and as a navigation aid to explore the earth. A GIS offers many tools to produce and display not only maps, but also 2D- and 3D models, simulations and other cartographic products. The output is often not static; you can interact with the visual to create dynamic views of the data. This could be for example simple zooming functions, showing the shortest route from A to B, or more complex modeling and simulating for disaster prevention. |
Zooming versus scaling
What is the difference between simple scaling and GIS powered zooming ? Use the button zooming / scaling to switch between these two modes and find it out. Use the + / - buttons to zoom in / zoom out or to scale in / scale out. Use the reset button to restart.
| www.gis.zh.ch GIS of canton Zürich with link to GIS-Browser. www.ag.ch/agis GIS of canton Aargau with links to interactive maps. www.gis-luzern.ch GIS of canton Luzern with link to map server. www.mappy.de Online route planner and interactive street maps for Europe, also for pda's and mobile phones. www.map24.com Online route planner and interactive street maps for Europe. Very fast. |
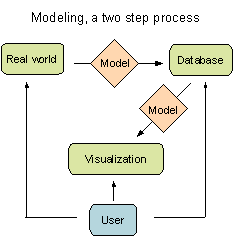
Modeling and simulationMost phenomena in nature are too complex to be represented in a GIS on a one to one basis. Therefore, you will have to simplify the real world and build your own data model according to the problem or task by concentrating on the essentials.
|
 |
The next step in the whole modeling process will be the creation of the visualisation model. It defines how and which part of the data model should be displayed.
|
|
|
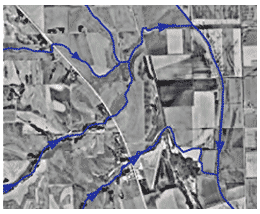
Simulation adds the element of time to a map. Not only the as-is can be showed, also past or future situations can be visualized using data models. This way the GIS can show different alternatives of a situation, which can be examined to help make better decisions. It can also make processes visible, that extend over days, months, and years, such as the drying out of lakes or the change in vegetation cover.


